D
Deleted member 1
Guest
This stuff below???@Splinty - what mechanism explains the D-R drift in the other states? Or is that data not being interpreted correctly?
You can't take anything from this guy accurately as he is ignoring things like whether states precanvas and/or precount ballots.
These are BATCH REPORTING times. Size of the batch is not standard.
Do you count everything at a central location in every state (far rural has to be transported to Austin in TX?)
There are a LOT of jumps this guy makes. In smaller states, the size of a city would be a limiting factor before distance like in Texas or Florida.
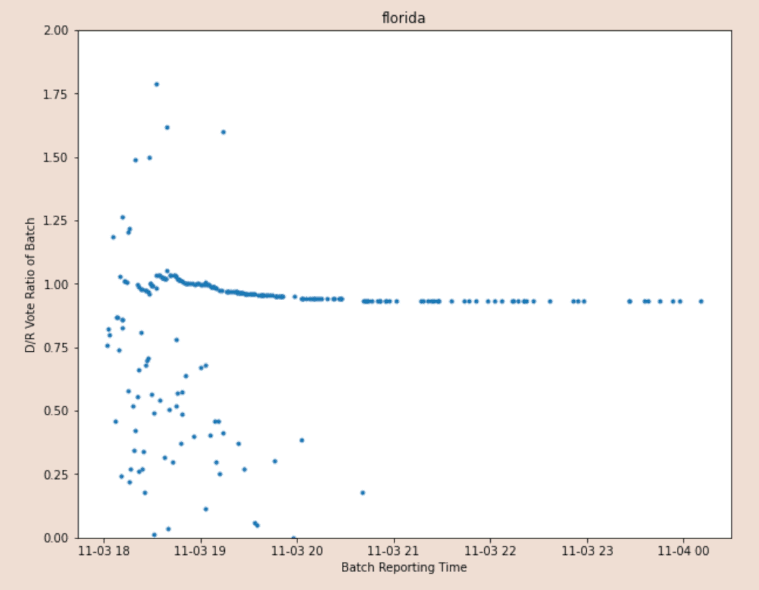
Here is a plot of the same Florida voting data, but this time it's the ratio of #Biden to #Trump ballots, versus time. What we see is that the initial ballot reportings are very noisy and "random".
The initial reporting represents in-person voting. These vote reports have such large variation bc in-person voting happens across different geographic areas that have different political alignments.
We can see this same pattern of noisy in-person voting, followed by homogeneous mail-in reporting in almost all cases.
What we see in almost all examples across the country is that the ratio of mail-in Dem to Rep ballots is very consistent across time, but with the notable drift from Dem to slightly more Rep.
This slight drift from D to R mail-ins occurs again and again, and is likely due to outlying rural areas having more R votes.